Requirements
- Install QGIS (LTR)
- Download the rawdata.
- These notes can be dowloaded here
The data
Shapefiles
Shapefiles are actually collections of files among which:
.shpcontains the geometry of the features.dbfcontains the attribute table.prjcontains the projection- other extensions are beyond the scope of this tutorial
There is no notion of resolution while manipulating these objects.
→ That does not mean that they were drawn with perfect precision!
Load the data: using Layer > Add Layer... > Add Vector Layer, load ./rawdata/NPL_adm3_UTM44N.shp
Raster data
Raster data are contained in a single file .(g)tif(f), .netcdf, ... They may also have attached file like .aux.xml but that is also beyond the scope of this tutorial.
They are organized as images with pixels, where each pixel can be attached to a single or several values. Each variable correspond to a band.
As real images they have a resolution, which often need to be taken into account in the processing flow.
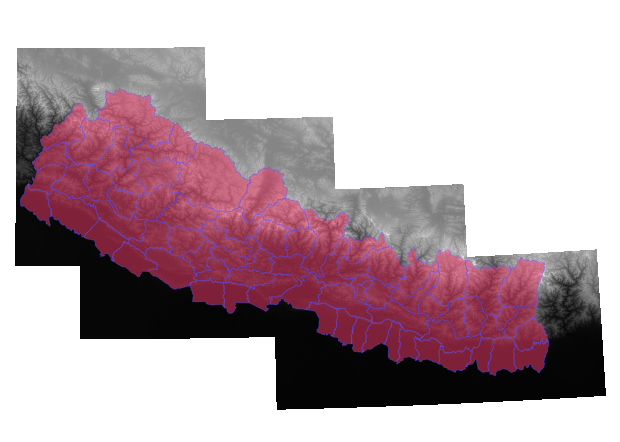
Load the data: using Layer > Add Layer > Add Raster Layer..., load ./rawdata/Nepal_WGS_UTM44N.tif
Visualization
In the Layers panel, change the transparency of the administrative limits layer using Right-click > Properties... > Symbology
In the Layers panel, open the attribute table using Right-click > Open Attribute Table
Processing
Extracting features
- Select the administrative limits layer in the
Layerspanel - Then using the
Select Featuresbutton, the an administrative unit, and - In the Layers panel, use
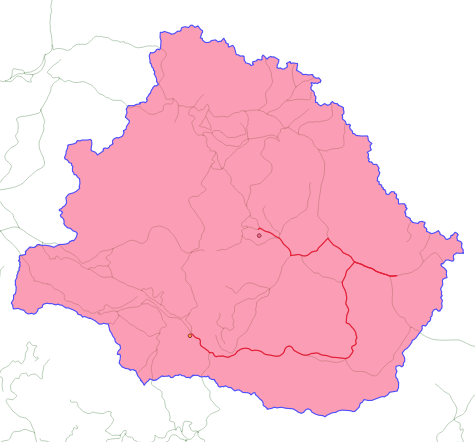
Right-click > Export > Save Features asand select theSave only selected featuresto save a single administrative unit in a new shapefile (use the formatESRI Shapefile).
Select Features button: ![]()
Clipping data
- In the
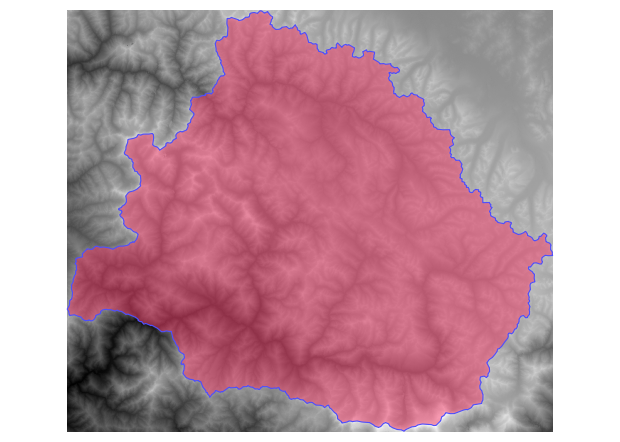
Toolboxpanel, search for the GDAL algorithmClip raster by extent - Set the parameters to extract the portion of raster overlapping with the adminstrative units, and run the algorithm
Toolbox button: ![]()
Walking distance from a given point
Creating features
- First create a new point layer using
Layer > Create Layer > New Shapefile Layer - Enable editing mode using the
Toggle Editingbutton:
- Add a feature using the
Add Point Featurebutton:
- Save the changes using the
Save Layer Editsbutton:
- Disable editing mode using the
Toggle Editingbutton
Projection
- If you right click on a given and put your mouse on
Layer CRS, you can see the projection system it uses. See that the point layer you just created in the previous step is not the same as the clipped raster from the previous step. - Reproject the administrative layer using the same projection system as the raster one (EPSG:32644) by searching
Reproject layerin theToolboxpanel.
The algorithm
- In the
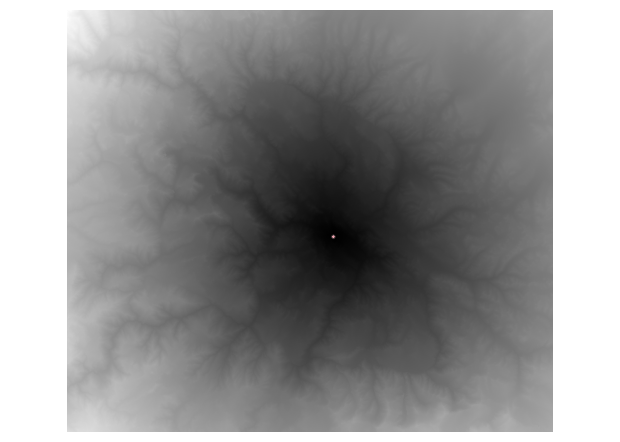
Toolboxpanel, search for the GDAL algorithmr.walk.points - Set the parameters and run the algorithm
Zonal statistics
- In the
Toolboxpanel, search for the GDAL algorithmZonal Statistics⚠️ This algorithm modify directly the layer file - Set the parameters to compute the average walking time to the point for the entire administrative unit
Network analysis
- Load the roads shapefile
./rawdata/roads/ - Add a secont point to the layer you created
- In the
Toolboxpanel, search for the GDAL algorithmShortest Path (layer to point) - Set the parameter in order to find the shortest paths between the points of your layer and a point that you will point in the canvas, and run the algorithm